
Intrigued by a very interesting post by “loomi” on the discussion forum, I wanted to find out more…
What he did was use the RFM12B as a crude spectrum analyzer: sweep the frequency across its entire range, and use the RSSI threshold and status bit to find out whether there is any signal on that frequency.
First of all, I added an rf12_control() function to the RF12 library, to allow access to the low-level registers of the RFM12B. This allows changing the frequency and RSSI settings, and reading out the RSSI status bit.
On the software side, a sketch is needed for the JeeNode which does the sweeping and measuring:
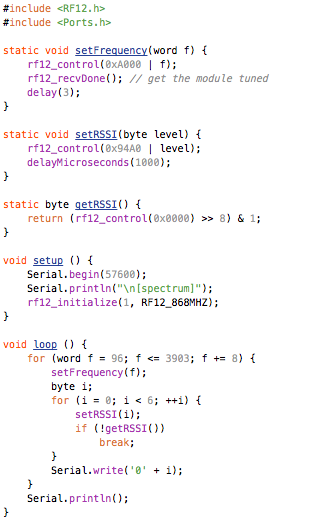
This reports one line of 476 digits 0..6 for each sweep. Each digit in this line of text represents the measured signal strength at that particular frequency.
The RSSI readout is very crude. All you can do is set a threshold and read out a single bit in the status register, telling you whether the signal is above or below the threshold. Tedious, but doable.
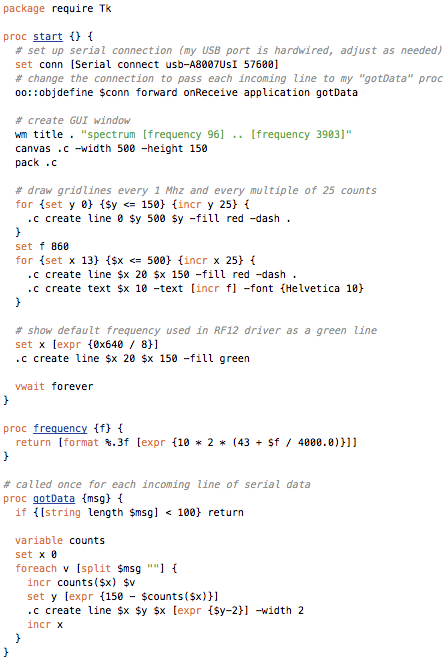
The fun part starts once you get to plotting this as a graph. I used JeeMon and wrote a Tcl/Tk script for it:
And here’s some sample output:
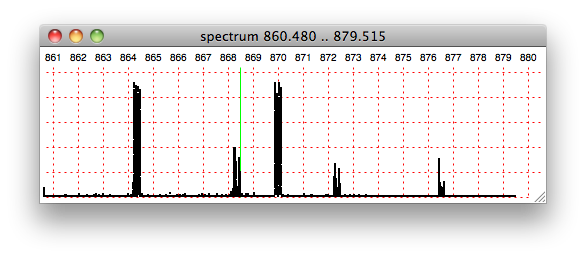
The green line is the default frequency setting of the RF12 driver.
Each sweep will add a set of black dots to the graph, but since the values are being accumulated in a “counts” array, the dots will creep higher and higher, drawing a bar as more sweeps come in. Using the current delays, one sweep takes a few seconds, so to get the above graph I had to keep JeeMon running for a few minutes.
When left running for some 15 minutes, the large bars will move out of range, but the smaller accumulated counts will now become clearer:
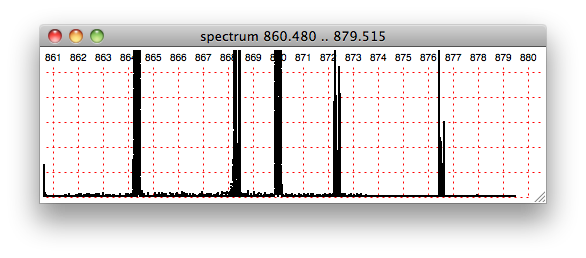
I haven’t figured out whether these values are valid, nor what could be causing all this RF activity. The peaks are fairly sharp though, so it would seem like a reasonable set of measurements.