
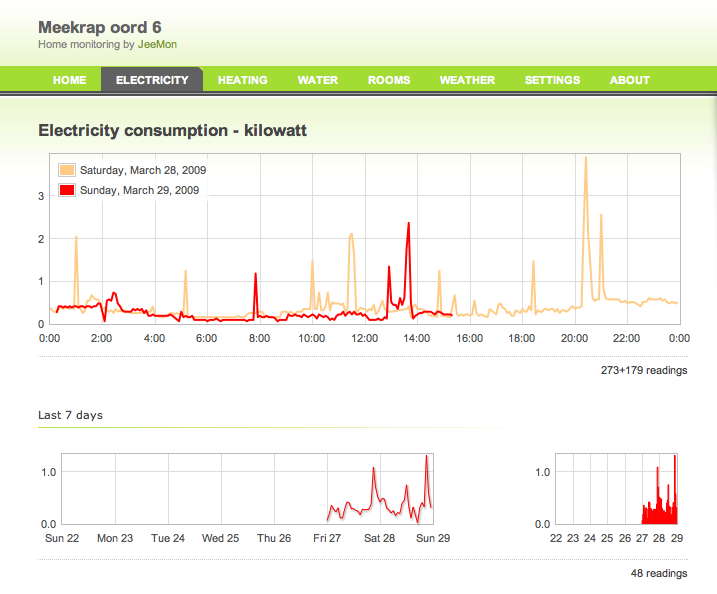
I’ve started work on a basic website design for JeeMon:
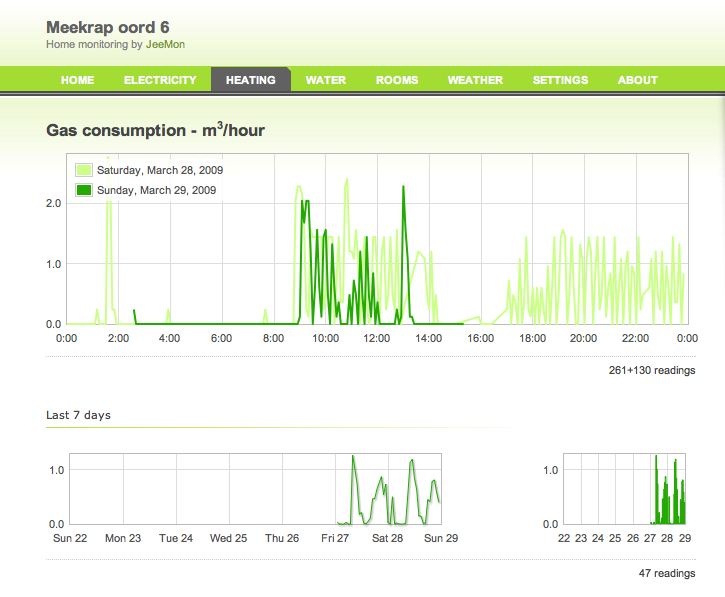
Here’s the gas consumption page:
The same JeeMon code is currently running on the “production” (ahem) JeeHub and on my development Mac.
These are real live webpages, with real (but not yet 100% correct) datasets. Still, this is just a tiny tip of a massive iceberg. Lots and lots of things left to do.
Well, at least it’s a pretty iceberg IMO ;)
Very pretty, I like the design. My I ask what framework you are using for the graphs? thnks
Nice clean design JC! I am following a different path myself (Google charts) but this looks very good! Not to many contract jobs currently I presume ;-)