
And here’s the electricity and gas consumption for (part of) last Wednesday:
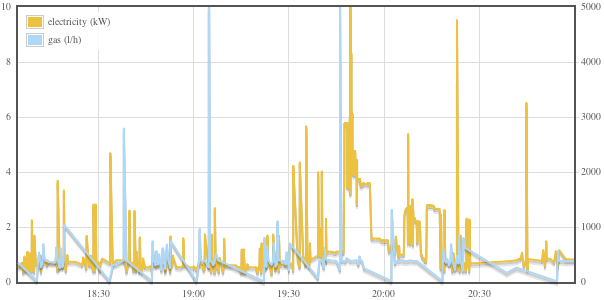
There are some quirks due to the way things are measured. The meter cannot accurately detect when gas consumption drops to zero, since that simply produces no readings. This can be resolved by adding fake readings when a very low consumption is reported, estimating the times when the gas flow stopped and then started again.
The electricity peaks at 19:45 are from the induction stove, the one around 20:15 is probably the close-in boiler.
This Tcl code generates the necessary HTML/JavaScript snippet to produce the plot:
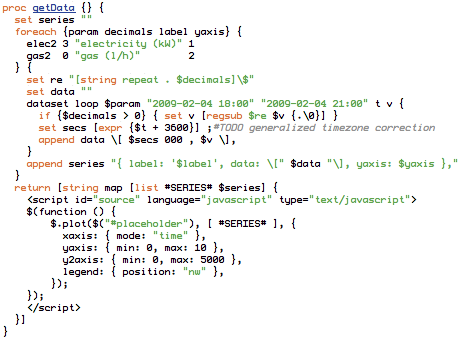
All measurement data selection is handled by the “dataset loop” command, which takes a measurement parameter name, the selection range, and the names of the time and value variables to set during the loop.